Continuing Education, brought to you by PM Code Corner
Continuing education: Designing right-sized plumbing systems for housing affordability, water efficiency and public health
Creating spaces that are safe, welcoming and healthy for all occupants.

This article equips plumbing engineers and system designers with the knowledge to apply right-sizing strategies for residential plumbing systems based on modern water use data. Participants will explore how traditional pipe-sizing methods, specifically the Hunter’s Curve, often result in oversized systems that increase costs, waste water, and contribute to water quality issues. The article introduces design methodologies that align with current fixture efficiency standards and water usage patterns, with a focus on multi-family systems. Emphasis will be placed on how right-sizing using the IAPMO Water Demand Calculator supports housing affordability, accelerates hot water delivery, and helps mitigate waterborne health risks, while contributing to sustainability goals in the face of urbanization and climate change.
Moving beyond the hunter’s curve
For nearly a century, Hunter’s Curve has served as the foundation for estimating water demand in residential, commercial, and institutional buildings. Developed in the 1940s by Roy B. Hunter, a physicist employed with the U.S. National Bureau of Standards (now the National Institute of Standards and Technology), the curve was part of a broader effort to create standardized methods for sizing plumbing systems in buildings of various occupancies. At the time, the plumbing industry lacked a coherent, data-driven approach to predict peak water demand. Most sizing methods were based on either empirical rules-of-thumb or significantly conservative estimates, often resulting in inconsistent and sometimes inadequate water distribution infrastructure.
Thanks to mass manufacturing of plumbing parts and the standardization of residential and commercial building types, plumbing fixtures such as toilets, faucets, and bathtubs became more uniform in design and water use. Hunter’s objective was to develop a rational method for translating the number and type of plumbing fixtures in a building into a reliable estimate of peak water demand, accounting for the improbability that all fixtures would be used simultaneously. The goal for Hunter was to find a standardized and simple way to calculate water demand for buildings that would accommodate all needs by all users, all the time. The concern was not water conservation, but effective and uninterrupted distribution. To accomplish this, Hunter introduced the concept of “fixture units,” which allowed designers to categorize fixtures by their relative load on the water supply system. Each type of fixture was assigned a specific number of fixture units based on its average flow rate and usage characteristics.
Courtesy of IAPMO
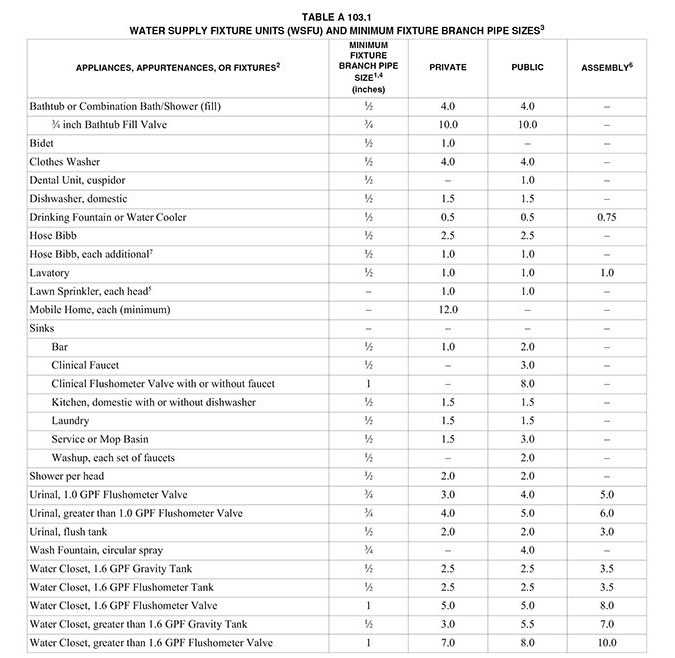
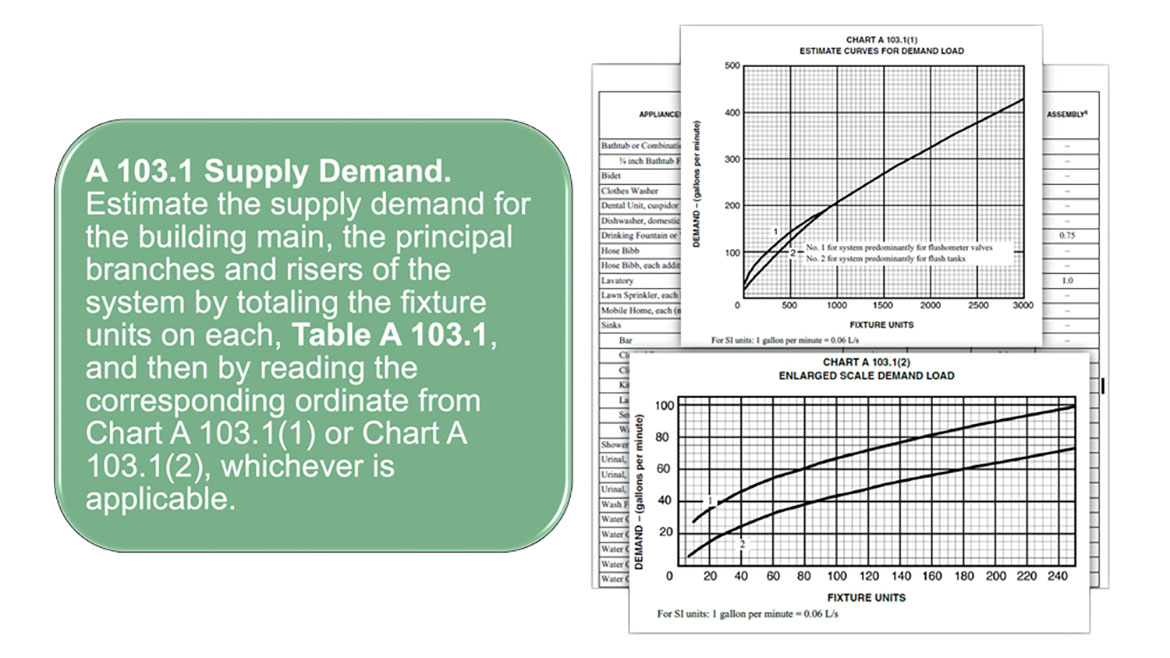
Hunter applied probabilistic modeling to determine the likelihood of concurrent fixture use within a building. The resulting model, now known as the Hunter’s Curve, plotted the total number of fixture units on the horizontal axis and the predicted peak water demand on the vertical axis. This curve allowed engineers and designers to size supply piping and equipment based on the 99th percentile of a binomial distribution of a given number of different kinds of plumbing fixtures. In effect, Hunter’s Curve introduced a discrete probabilistic method to prevent under-sizing while avoiding the extreme costs and inefficiencies of over-designing the plumbing system.
Courtesy of IAPMO
The Hunter’s Curve and its associated fixture unit method were adopted into plumbing codes and handbooks throughout the mid-20th century and remain in use today in various forms. The Uniform Plumbing Code (UPC) and the International Plumbing Code (IPC) both base their sizing methodologies on these principles, even though they have since made minor adjustments to reflect evolving fixture efficiencies and building uses.
As awareness has increased that different buildings have different usage patterns and plumbing fixtures have become increasingly efficient due to codes and standards such as the Energy Policy Act of 1992 and WaterSense labeling, the underlying assumptions behind Hunter’s Curve have become less valid. Flow rates for fixtures such as toilets and faucets have dropped significantly, often by more than 50 percent since Hunter’s time. Moreover, modern society has buildings with distributed occupancy patterns, irregular schedules, and usage profiles influenced by automation and behavior changes. For example, high-efficiency sensor-activated faucets, low-flow toilets and smart metering all contribute to a water demand landscape fundamentally different from what Hunter observed in the 1940s.
In principle, a plumbing water distribution network should be tailored to the specific occupancy patterns, fixture types, and usage profiles of the building it serves. This is particularly true for multi-family buildings, where the diversity of use can already introduce variability. Oversized systems result in multiple inefficiencies. First, excessive pipe diameters lead to increased material costs, which are passed on through higher construction budgets. Second, oversized systems often experience low velocity flows, especially at off-peak times. This contributes to stagnation in the distribution system, raising concerns related to water age, microbial growth and water quality. In healthcare settings and large commercial buildings, where waterborne pathogens such as Legionella can be a concern, the mismatch between system size and actual flow can create unintended public health risks.
The development of Hunter’s Curve was groundbreaking, and represents a landmark in plumbing engineering history. However, research and the development of new calculation technology have moved past the need for a mid-20th-century statistical model. Proper sizing of water systems involves more than just code compliance. It demands an understanding of actual fixture flow rates, building usage schedules and the hydraulic behavior of water distribution networks. As fixture efficiencies improve and occupancy patterns become more dynamic, historical sizing methods that favor generous safety margins increasingly lead to inefficiency. The goal of modern plumbing design should be to align system capacity with demand in a way that maximizes performance without introducing waste—whether of water, energy, or capital resources.
More is not always better: Myths vs. reality in plumbing design
The building industry tends toward slow and cautious adoption of new technologies and building methods. Despite the availability of modern tools, some inertia remains in plumbing design practices, and many engineers continue to use legacy spreadsheets or sizing assumptions, often out of habit or perceived risk. Though outdated, costly, and potentially dangerous for occupants, this reluctance to adopt new technologies is firmly fixed in best intentions.
One of the primary reasons plumbing design has been slow to evolve is the deeply rooted concern that occupants may not receive sufficient water during periods of peak demand. This concern drives designers to err on the side of abundance, often resulting in systems that can deliver far more water than a building will realistically require. The underlying assumption is that reliability—particularly during peak use—can only be ensured by oversizing. While this approach may seem prudent, it leads to systems that are inefficient, costly, and increasingly out of step with the actual demands of modern buildings.

Christoph Lohr, Vice President of Technical Services and Research at IAPMO and a nationally recognized plumbing engineer and water systems advocate, is a frequent presenter on the benefits of using the IAPMO Water Demand Calculator® instead of the outdated Hunters Curve. Courtesy of IAPMO
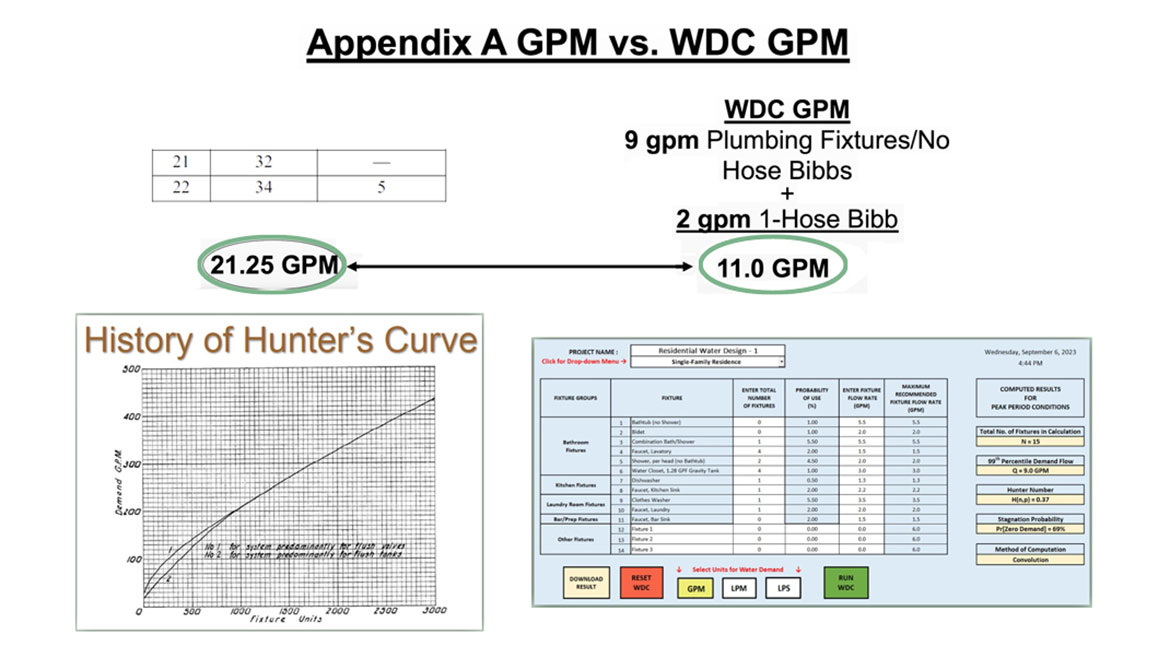
Numerous studies conducted in the past two decades have consistently shown that Hunter’s Curve tends to overestimate peak water demand by substantial margins—with some studies showing that this margin is by factors ranging from five to 27 times the actual observed flow rates. These findings have emerged from flow monitoring of hot water systems in multi-family applications. In many cases, systems designed according to Hunter’s Curve experience maximum demands that barely reach 10 to 20 percent of their theoretical peak capacity. This has serious implications for both the design and operation of modern plumbing systems.
Modern sizing approaches, including probabilistic modeling and real-time usage profiling, provide more accurate and resource-conscious design options. But adoption lags, in part because the industry continues to prioritize perceived robustness over demonstrated performance. Shifting this paradigm will require not just technical innovation but also cultural and regulatory change that rewards precision rather than excess. Until then, most plumbing systems will continue to be built for demands they will never encounter.
The IAPMO Water Demand Calculator – A new standard for residential sizing
Recognizing the need for a more accurate, reliable, and consistent tool for predicting water demand and usage, the plumbing industry responded by first creating an extensive field study in 2009 and then developing a sophisticated yet easy-to-use tool.
Introduced in 2017 by IAPMO, the Water Demand Calculator tool was developed in response to a growing body of evidence that traditional water demand estimates were no longer accurate or appropriate for modern buildings with water-conserving “efficient” fixtures. The IAPMO Water Demand Calculator represents a significant advancement in plumbing system design, offering a scientifically grounded alternative to methods and assumptions based on Hunter’s Curve.
The development of the calculator was driven by a multidisciplinary team of engineers and statisticians. Their goal was to create a tool that would be accurate, accessible, and acceptable for inclusion in plumbing codes. At the heart of the IAPMO Water Demand Calculator is a modern statistical model based on extensive field data and probabilistic analysis. Unlike Hunter’s Curve, which relies on fixture unit counts and assumptions about simultaneous usage, the IAPMO Water Demand Calculator uses empirical data gathered from real-world water usage in contemporary single-family dwellings. This includes data on fixture flow rates, frequency of use, duration of use and occupancy patterns—factors that have evolved significantly over the past several decades due to changes in regulations, technology and lifestyle.
What distinguishes the IAPMO Water Demand Calculator from previous projected water use methods is the inclusion of real-world observed data. In 2013, IAPMO, the American Society of Plumbing Engineers (ASPE), and the Water Quality Research Foundation (WQRF) jointly funded a research project using data provided by Aquacraft Inc. to update Hunter’s Curve for estimating water supply for residential applications using water-efficient fixtures. A special task force led by Dan Cole (IAPMO) and comprised of members from ASPE and the University of Cincinnati was formed to revise the methodology for properly estimating water supply demands in response to the increased use of water-conserving plumbing fixtures, fixture fittings, and appliances, and the subsequent decreased demand for water in commercial buildings and residences. The charge of the task group was to develop a statistically based probability model that would predict the peak water demand for single and multi-family dwellings having water-conserving plumbing fixtures.
The first step in the process of developing a more accurate way to calculate water demand started with a broad and extensive research and statistical data-gathering venture. The research resulted in a published document in 2017 called the Peak Water Demand Study: Executive Summary. The Peak Water Demand Full Study was released in 2025.
Over 1,000 single-family households were used as the basis of the study. Using portable data loggers connected to each home’s main water supply line, the research team captured real-time water flow data every 10 seconds. Each recorded instance of water usage or “event” included information on flow rate, duration and total volume. By aggregating this data, the researchers were able to build a detailed database of when and how often plumbing fixtures were used.
To understand specific water demand and usage, six unique fixture groups were identified as common to most of the 1,000 participating homes. For each fixture, both events (single-time demand calls) as well as overall volume were recorded and considered.
Faucets had the highest percentage of water use events at about 75%, with a 21% volume of water consumed. In contrast, showers and clothes washers recorded less than 3% each of water use events but accounted for about 24% each of the volume of water consumed. Toilets had the highest volume of water consumed at a fixture, while dishwashers had the lowest number of events and volume of water consumed. Although the number of water-use events shows a wide variation in the frequency of fixture use, the duration and flow volume are consistent with typical residential fixture characteristics.
In total, the study recorded about 863,000 water use events, excluding leaks. From this dataset, the team calculated the relative frequency of fixture use as a proportion of total system demand. These usage patterns, the number of fixtures and appliances, along with their respective flow rates, were fed into statistical algorithms to calculate peak demand.
Although the national database had water use records for only single-family homes, the statistical information was found to be valid and applicable for multi-family dwellings, as well. Because it can be assumed that each unit in a multifamily building operates independently of the other units, water use data from multiple randomly selected single-family households were assembled and assumed to be units in a building to mimic water use in a multifamily building.
One of the major flaws in the older Hunter’s Curve methodology was the unrealistic assumption that a building’s water system should be sized to supply fixtures under congested use, i.e., a line of people waiting to use the fixture. The field data clearly disproved this notion. Instead, the study identified the “peak hour” of demand—the single hour with the highest volume of water use—and assessed the probability that each fixture was active during this period.
Armed with actual statistical and observable results, IAPMO embarked on updating Hunter’s Curve and establishing a new computational model based on field data. The result was the IAPMO Water Demand Calculator tool.
Courtesy of IAPMO
One of the key technical innovations of the IAPMO Water Demand Calculator is its dynamic treatment of fixture characteristics. Unlike Hunter’s Curve, which assigns a fixed fixture unit value regardless of fixture type or efficiency, the calculator distinguishes between flow rates and probabilities of use for each fixture. For example, a high-efficiency showerhead and a traditional tub faucet are modeled differently, reflecting their divergent flow profiles and usage frequencies. These refinements allow the IAPMO Water Demand Calculator to respond to code-mandated changes in fixture specifications, such as the 1.28 gallons per flush requirement for toilets or the 1.5 gallons per minute limit for bathroom faucets under EPA WaterSense Specifications.
In addition, the calculator accounts for the diversity of demand within multifamily housing by accounting for each individual fixture in each dwelling unit and then aggregating their demand probabilistically. This approach avoids the overestimation common in aggregate fixture unit counts. This is especially important in large buildings where traditional sizing methods lead to increasingly oversized systems. In contrast, the IAPMO Water Demand Calculator’s probabilistic framework reflects the fact that not all residents use water fixtures simultaneously or at full flow rates, even during peak periods.
This article is part our continuing education program, Code Corner, and is sponsored by IAPMO. To read the full article and receive CE credits, visit the Code Corner website here.
To receive credits, you are required to read the entire article and pass the quiz.
Looking for a reprint of this article?
From high-res PDFs to custom plaques, order your copy today!


