Fun With A FLIR
Infrared thermography reveals heat transfer in action.

Winters in upstate New York are long and cold. Nighttime temperatures often drop well below zero. It’s a time when temperature differences between heated and unheated spaces are at a maximum, and heat systems are running at peak loading. It’s also a great time to take a look at heat transfer in action.
Last January, I made arrangements to use a FLIR T-400 thermal imaging camera for a few days. This instrument, shown in Figure 1, sells for about the same price as a new car, but if you’re in the business of identifying where heat is present, and how it’s moving, this instrument is invaluable.
 Thermal imaging cameras like the T-400 detects infrared (IR) light emitted by whatever surfaces the camera is pointed at. IR light is like visible light with the exception that the human eye cannot see it.
IR thermographic imaging is probably best known for its use in military “night vision” systems. Such systems detect differences in surface temperature based on emission of IR radiation, and then convert that information into an image visible to the eye. In military aviation, this technology has been refined to the point where helicopter pilots can fly close ground support in total darkness, identify targets by their “heat signature,” and lock weapons onto those targets in the same manner.
Outside the military, IR thermography also has become widely used in building energy surveys, as well as for diagnosing faults in industrial equipment and utility distribution systems. In short, the camera lets you see the range of surface temperatures within the viewing field of the lens.
These imaging devices are also useful to those working in the HVAC field, especially when portions of heating systems are hidden behind surfaces. Radiant panel heating systems using embedded tubing are a perfect example. So are pipes or ducts concealed behind walls.
The ability of the T-400 to automatically detect the range of temperature in its view field and then adjust the colors it displays to this range is extremely helpful. If the range of temperatures is small, the full color spectrum displayed is mapped to that range. This allows you to spot very small temperature variations such as the slightly cooler drywall surface temperature behind a wall stud.
What follows are thermographic images that reveal the nature of typical hydronic installations. The first is a sequence of four images that show the flow of hot water into a steel panel radiator from seconds after the radiator valve is opened, to about 4 minutes later. These images confirm that panel radiators are fast responders when coming out of a setback condition. The final image shows an excellent surface temperature distribution across the radiator surface as the panel nears a steady-state condition.
 Figure 3 is an image showing a panel radiator at steady-state condition with its thermostatic valve on the low setting of one (within a range of one to five). Take a look at the temperature scale on the right, as well as the crosshairs showing the spot temperature on the yellow. My estimate is that the temperature drop across this panel under this condition is around 40 degrees - just what’s needed for low heat output and very low corresponding flow rate. This image also confirms an even flow distribution among the vertical channels connecting the top and bottoms headers of the panel.

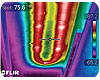 Another interesting image comes from the floor area directly below where Figure 4 was taken. Figure 5 is an upward shot at an uninsulated joist cavity facing the basement. Above the joists is a 3/4-inch plywood subfloor to which the 3/8-inch copper tubing is clamped. You can even see the copper clamps that hold the tubing to the subfloor (the white bright spots along the red streaks).
It’s very evident the floor gets warm on the bottom side, and this makes the underside of the plywood serve as a radiant ceiling to the space beneath (intentional or otherwise). In my case, this downward radiant heat keeps the basement area below the bedroom partially heated. It’s acceptable because the entire house, including this area of the basement, is controlled as a single zone. Probably not the way I would design or install the system today, but I can attest that this system has kept us comfortable for almost three decades.


You can also find the framing from the inside of the building. As long as heat is flowing through the wall, the drywall surfaces over the framing will be slightly cooler than those backed by insulation. Studs and other framing are readily apparent as cooler colors. I would estimate you could find the center of a stud within a 1/4 inch or so, especially if there is a large temperature differential across the wall.
You can even pinpoint drywall screws hidden under joint compound and paint because they create a small “dot” of lower temperature. The T-400 has a laser pointer built in. With the push of a button you can put a laser spot on the surface at the exact location of the crosshairs on the camera display.


This is a healthy radiant panel, with good lateral heat transfer away from the tubing courtesy of 6-inch aluminum heat transfer plates. You can see some difference in surface temperature within the red stripes. This is likely caused by variations in contact between the aluminum plates and the rear of the 1/2-inch drywall. The white spots are where the drywall is screwed to the materials behind it. This “clamping effect” improves contact between the drywall and plates and, thus, improves conduction heat transfer. The blue blotch in the lower left is a receptacle mounted in the wall. We decided to leave out the heat transfer plates near the receptacle to avoid heating it. Apparently it works.
 If you don’t think heat transfer plates make a difference, take a look at Figure 10. It shows return bends in the 1/2-inch PEX-AL-PEX tubing at the end of the radiant wall shown in Figure 9. The plates end where the curves begins. Although there is obviously some output from the return bends, it’s certainly not producing a surface temperature distribution comparable to the plated areas. It’s a good example of thermal constipation in action.
 A radiant ceiling constructed the same way as the radiant wall is shown in Figure 11. Imagine lying on the floor beneath this ceiling. Although the thermal image makes the ceiling look like the heating element in a giant oven, all the occupants would feel is gentle radiant warmth. By the way, can you tell which direction the water is flowing across the ceiling by the color distribution?
 Finally, for you sportsmen out there, take a look near the center of Figure 12. This image was taken from my office window, in complete darkness, about 10 p.m. on a January night. The camera is pointing at a small meadow with woods behind.
Any guess what those two white areas are? Answer: Two whitetail deer waiting patiently to cross the road and munch on our cedar hedge. I tried shooting the camera’s laser pointer at them, but they weren’t getting the message.
After shooting hundreds of images, and even some MP4 videos with this instrument, I really didn’t want to pack it up and return it to FLIR, but for some reason they definitely wanted it back.
FLIR makes several models of IR thermal imaging cameras, and some of those are much less expensive than the T-400. It really depends on the features you need (want) and how you plan to use the device. These cameras are also available for rental.
If you’re involved with diagnosis of heating systems, or building heat transfer on a daily basis, you probably already own an instrument like this. If not, you should.
Guess what’s on my Christmas list?
Figure 1
Winters in upstate New York are long and cold. Nighttime temperatures often drop well below zero. It’s a time when temperature differences between heated and unheated spaces are at a maximum, and heat systems are running at peak loading. It’s also a great time to take a look at heat transfer in action.
Last January, I made arrangements to use a FLIR T-400 thermal imaging camera for a few days. This instrument, shown in Figure 1, sells for about the same price as a new car, but if you’re in the business of identifying where heat is present, and how it’s moving, this instrument is invaluable.
Figure 2
IR thermographic imaging is probably best known for its use in military “night vision” systems. Such systems detect differences in surface temperature based on emission of IR radiation, and then convert that information into an image visible to the eye. In military aviation, this technology has been refined to the point where helicopter pilots can fly close ground support in total darkness, identify targets by their “heat signature,” and lock weapons onto those targets in the same manner.
Outside the military, IR thermography also has become widely used in building energy surveys, as well as for diagnosing faults in industrial equipment and utility distribution systems. In short, the camera lets you see the range of surface temperatures within the viewing field of the lens.
These imaging devices are also useful to those working in the HVAC field, especially when portions of heating systems are hidden behind surfaces. Radiant panel heating systems using embedded tubing are a perfect example. So are pipes or ducts concealed behind walls.
The ability of the T-400 to automatically detect the range of temperature in its view field and then adjust the colors it displays to this range is extremely helpful. If the range of temperatures is small, the full color spectrum displayed is mapped to that range. This allows you to spot very small temperature variations such as the slightly cooler drywall surface temperature behind a wall stud.
What follows are thermographic images that reveal the nature of typical hydronic installations. The first is a sequence of four images that show the flow of hot water into a steel panel radiator from seconds after the radiator valve is opened, to about 4 minutes later. These images confirm that panel radiators are fast responders when coming out of a setback condition. The final image shows an excellent surface temperature distribution across the radiator surface as the panel nears a steady-state condition.
Figure 3
Figure 4
Lines On The Floor
A thermal imaging system can sure be convincing when it comes to radiant panel performance. Take a look at Figure 4. It’s from a system that I installed in our home almost 30 years ago. This panel used 3/8-inch copper tubing clamped to a plywood subfloor. The tubes were then covered with a 3/4-inch-deep layer of mortar. Above this is pad and carpet. The stark contrast in color makes it easy to find the tubes. Based on the color scale at the right of the image, the variation in floor surface temperature across the panel is around 10 degrees.Figure 5
It’s very evident the floor gets warm on the bottom side, and this makes the underside of the plywood serve as a radiant ceiling to the space beneath (intentional or otherwise). In my case, this downward radiant heat keeps the basement area below the bedroom partially heated. It’s acceptable because the entire house, including this area of the basement, is controlled as a single zone. Probably not the way I would design or install the system today, but I can attest that this system has kept us comfortable for almost three decades.
Figure 6
Objects On The Floor
Figure 6 is an image showing the plastic case the T-400 camera came in lying on a heated floor. It was there for several hours before this image was taken. You can see how its presence has affected heat output from the floor. The floor surface temperature adjacent to the case, as well as under the case, is a few degrees higher than those a few inches away from it (note the narrow range shown on the temperature scale). The thermal resistance of the case is inhibiting upward heat flow. The temperature distribution around the case adjusts, over a period of hours, to establish a new equilibrium condition.Figure 7
Framing Finder
Figure 7 demonstrates that it’s relatively easy to find the framing in a heated building on a cold night. This is possible because framing doesn’t have the same thermal resistance (R-value) as the insulation between the framing. Thus, the outside wall surface is slightly warmer directly in front of the framing, and the T-400 easily detects this.You can also find the framing from the inside of the building. As long as heat is flowing through the wall, the drywall surfaces over the framing will be slightly cooler than those backed by insulation. Studs and other framing are readily apparent as cooler colors. I would estimate you could find the center of a stud within a 1/4 inch or so, especially if there is a large temperature differential across the wall.
You can even pinpoint drywall screws hidden under joint compound and paint because they create a small “dot” of lower temperature. The T-400 has a laser pointer built in. With the push of a button you can put a laser spot on the surface at the exact location of the crosshairs on the camera display.
Figure 8
Convection Plumes
Whenever I hear someone say “heat rises,” I usually correct them saying “heat moves from higher temperature to lower temperature; hot air rises.” Take a look at Figure 8. The bright glow is from a small towel warmer radiator. The bluish colors behind the radiator and on the ceiling above it show the effect of natural convection, which has warmed these surfaces. The IR camera is not seeing the rising warm air directly, but rather the effect the air has on nearby surfaces.Figure 9
Do Plates Make a Difference?
Figure 9 shows an image of a 4-foot-tall radiant wall in the upstairs of our office. It’s operating at near steady-state conditions, and only took about 25 minutes to reach this condition from a cool start.This is a healthy radiant panel, with good lateral heat transfer away from the tubing courtesy of 6-inch aluminum heat transfer plates. You can see some difference in surface temperature within the red stripes. This is likely caused by variations in contact between the aluminum plates and the rear of the 1/2-inch drywall. The white spots are where the drywall is screwed to the materials behind it. This “clamping effect” improves contact between the drywall and plates and, thus, improves conduction heat transfer. The blue blotch in the lower left is a receptacle mounted in the wall. We decided to leave out the heat transfer plates near the receptacle to avoid heating it. Apparently it works.
Figure 10
Figure 11
Figure 12
Any guess what those two white areas are? Answer: Two whitetail deer waiting patiently to cross the road and munch on our cedar hedge. I tried shooting the camera’s laser pointer at them, but they weren’t getting the message.
After shooting hundreds of images, and even some MP4 videos with this instrument, I really didn’t want to pack it up and return it to FLIR, but for some reason they definitely wanted it back.
FLIR makes several models of IR thermal imaging cameras, and some of those are much less expensive than the T-400. It really depends on the features you need (want) and how you plan to use the device. These cameras are also available for rental.
If you’re involved with diagnosis of heating systems, or building heat transfer on a daily basis, you probably already own an instrument like this. If not, you should.
Guess what’s on my Christmas list?
Links
Looking for a reprint of this article?
From high-res PDFs to custom plaques, order your copy today!


