10 Riskiest U.S. Cities for Plumbing Problems After Moving In
Roto-Rooter analyzed 46 cities across five weighted plumbing risk factors.
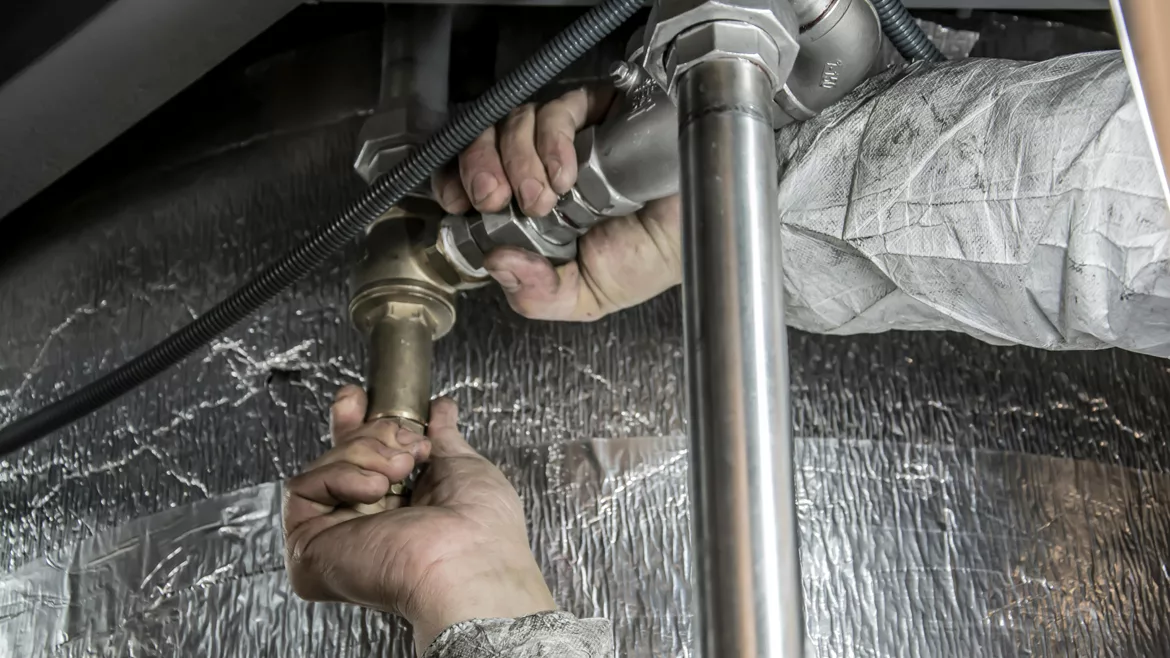
Between May and September, millions of Americans relocate into new homes with pipes they’ve never tested, in cities where the infrastructure beneath the streets is older than their parents. Most people inspect the walls, the roof, the appliances. Almost nobody asks about the pipes, which is an oversight that can become a major regret for many movers.
To help movers make smarter decisions, Roto-Rooter, North America’s largest provider of plumbing repair and sewer & drain cleaning services, analyzed 46 cities across five weighted plumbing risk factors:
- Real-world service call volume
- Housing age
- Water hardness
- Number of homes lacking complete plumbing
- Age and material of underground pipe infrastructure
The result is a plumbing risk Index, a data-driven ranking of the cities most likely to hand new residents a plumbing emergency and the ones that offer more peace of mind.
Key Findings:
- Rust Belt and Northeast cities dominate the high-risk end of the index due to aging housing, cast iron underground pipes, and harsh winters
- Sun Belt and Pacific Northwest cities lead the low-risk end thanks to younger homes, PVC pipe networks, and softer water. The risk is rarely absent in either region, just different in kind
The 10 Most At-Risk Cities
1. Kansas City, MO/KS (Risk Score: 7.8/10)
Kansas City tops the list primarily because of its water supply. At 300 parts per million (ppm) of hardness, its water ranks among the most mineral-laden in the study. At that concentration, limescale steadily builds up in water heaters, narrows pipe interiors, and shortens appliance lifespans regardless of a home’s age. When combined with housing that averages 63 years old and aging cast iron infrastructure, the city's 58.9 plumbing-related service calls per 100 households, the highest per-capita rate in the study, becomes far less surprising.
2. Wilmington, DE (Risk Score: 7.8/10)
Wilmington’s risk profile is largely driven by age. With an average home age of 72.7 years and 43% of all housing built before 1939, much of the city’s residential plumbing is at or beyond its intended service life. Cast iron water mains also serve a city located in the nation’s highest-break-rate infrastructure region, and its 62 service calls per 100 households, tied for the highest per-capita rate in the study, reinforces what the housing stock already suggests. Delaware's cold winters add freeze-thaw stress on top of that.
3. Camden, NJ (Risk Score: 7.6/10)
Camden’s risk profile is disproportionate to its size. In this dense urban environment, where 39% of homes predate 1939, aging cast iron infrastructure and repeated freeze-thaw stress combine to generate 56.8 service calls per 100 households, one of the highest per-capita rates in the study. For a city with roughly 28,000 households, that level of ongoing plumbing demand points directly to the underlying condition of its housing and pipe infrastructure.
4. Bridgeport, CT (Risk Score: 7.5/10)
Bridgeport’s risk is driven by the combined effects of hard water and aging cast iron infrastructure. With water hardness measured at 168 ppm, higher than most municipalities in the Northeast due to the city’s blend of surface water and groundwater from eight reservoirs, limescale gradually builds along interior pipe walls over time. Cold winters and repeated freeze-thaw cycles place additional stress on an already aging cast iron pipe network. Homes in the city average 70 years old, with 33% built before 1939. Service calls equate to 59.4 per 100 households, underscoring the ongoing plumbing strain facing residents.
5. St. Louis, MO (Risk Score: 7.1/10)
St. Louis has the oldest average housing age in the study at 79.3 years, and 58% of all homes predate 1939, meaning most of the city’s residential plumbing was installed when galvanized steel, cast iron, and lead solder were the primary available materials. All three are now at or nearing the end of their functional lifespan. Water hardness at 140 ppm adds ongoing mineral stress on top of that. Its 36 service calls per 100 households reinforces a concern many St. Louis residents face: not if a plumbing failure will occur, but when.
6. Buffalo, NY (Risk Score: 7.1/10)
Buffalo holds the oldest average home age in the entire study at 82 years, with 61% of homes predating 1939, hard water at 180 ppm drawn from Lake Erie's limestone basin, and some of the most severe freeze-thaw winters on the index. Freeze stress is the leading cause of circumferential pipe cracking nationally, and Buffalo's climate applies that pressure to a cast iron network already past its design life. Its per-capita service rate of 15.7 per 100 households is relatively moderate given all of that, a signal of resilience, though not immunity.
7. Dayton, OH (Risk Score: 6.8/10)
Dayton's risk profile is the Midwest story in mid-sized form. A 73-year average home age, hard water at 155 ppm drawn from a dolomite and limestone aquifer, and aging cast iron infrastructure in a region where water main break rates exceed the national average have produced 38.2 service calls per 100 households, a figure that is particularly striking for a city of Dayton's size and reflects the kind of sustained, year-round pressure that hard water and aging pipes place on a housing stock quietly absorbing both.
8. Cleveland, OH (Risk Score: 6.2/10)
50% of Cleveland's housing stock predates 1939, cast iron and ductile iron dominate its underground piping, and winters severe enough to rank among the coldest in the study impose freeze-thaw stress on systems already operating past their designed service lives. A lead service line replacement program is active, but the gap between its pace and the scale of the problem remains wide. Roto-Rooter recorded 12.0 service calls per 100 households in 2025, with elevated water-quality volume consistent with a system where pipe corrosion and mineral buildup generate continuous maintenance demand.
9. Baltimore, MD (Risk Score: 6.1/10)
Baltimore is the textbook case for Northeast industrial city infrastructure risk. More than 120,000 homes, 41% of all households, predate 1939, cast iron water mains dominate a pipe network spanning more than 4,000 miles, and corrosive Eastern Seaboard soils accelerate deterioration faster than replacement programs can keep pace. More than 48,000 service calls in 2025, or 16.5 per 100 households, reflect a plumbing system well past the midpoint of its expected service life.
10. Pittsburgh, PA (Risk Score: 5.9/10)
Pittsburgh rounds out the top ten where pre-war housing and hard water have spent decades compounding stress on aging cast iron infrastructure. With 48% of homes predating 1939, water hardness at 150 ppm driving steady scale accumulation, and cold winters adding freeze-thaw stress to a pipe network approaching the end of its design life, the city's 13.7 service calls per 100 households reflect the quiet, cumulative toll of steel-era construction.
Full Rankings at a Glance
Table 1: Plumbing Risk Index - Full rankings of 46 US cities ranked by composite plumbing risk score (0-10).
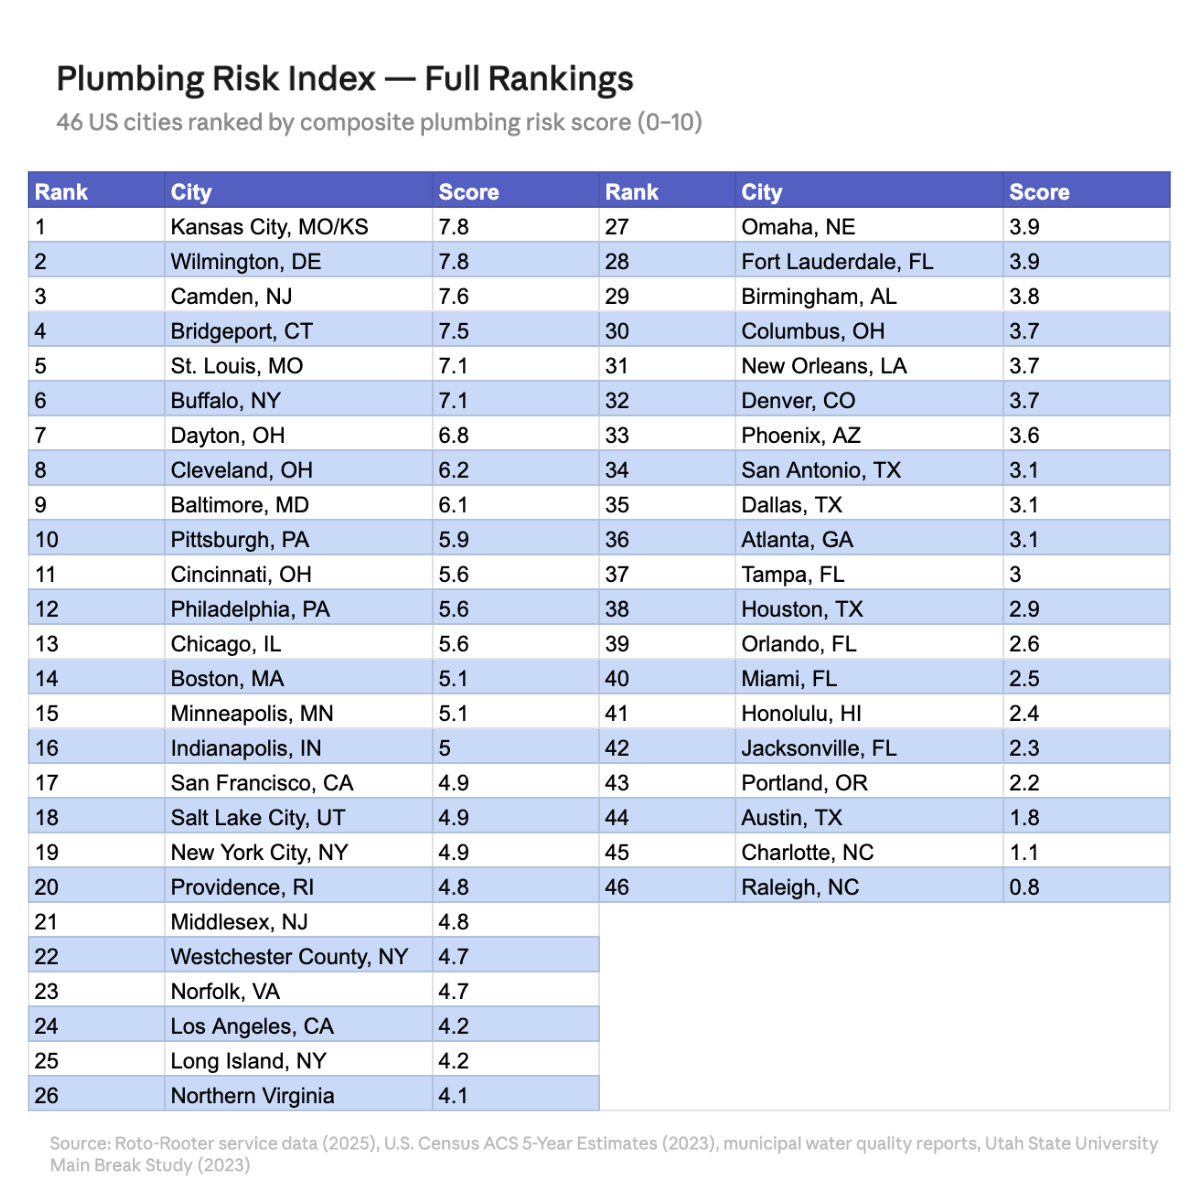 Image courtesy of Roto-Rooter.
 Figure 1: Scatter plot of all 46 cities by average home age and water hardness, with bubble size reflecting service call volume per 100 households. Note that pipe material risk, the fifth factor in this index, is not represented visually, though nearly every top-ten city sits in the two highest-risk infrastructure regions in the country.
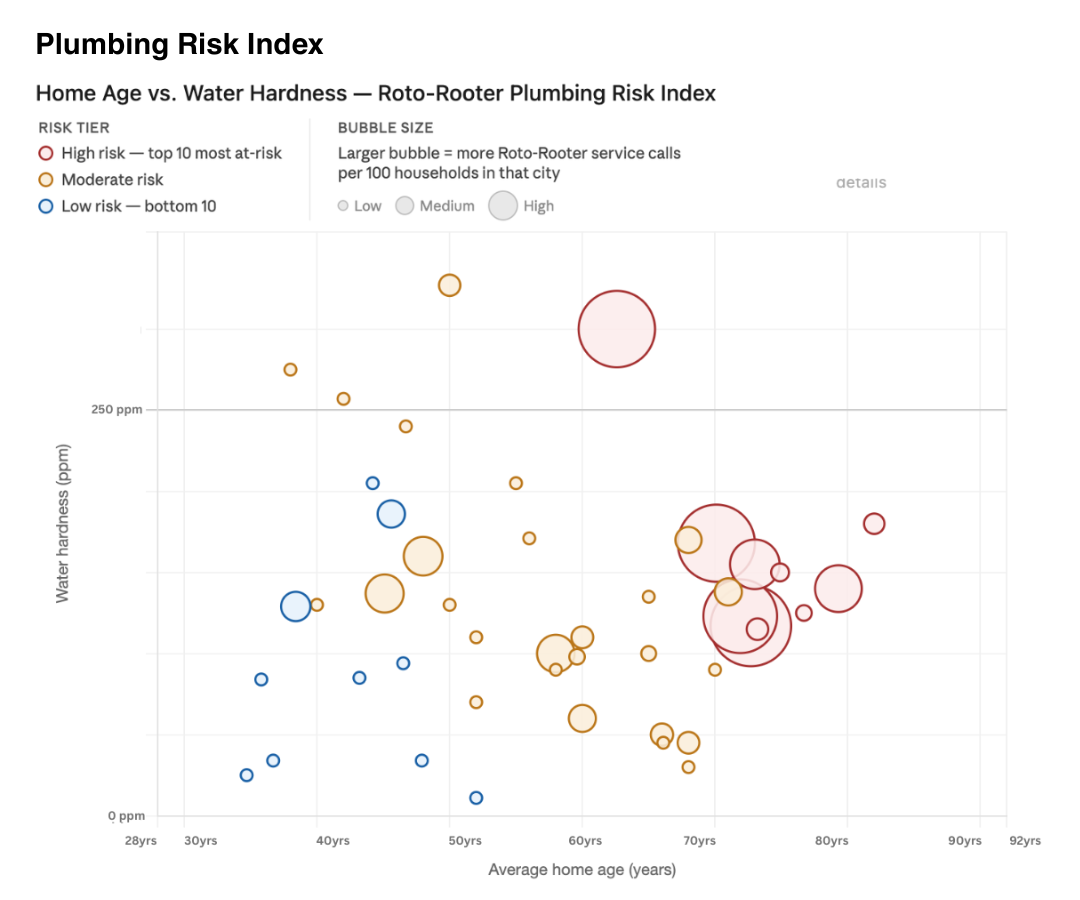 Image courtesy of Roto-Rooter.
 The Other End of the Index
Sun Belt and Pacific Northwest markets dominate the bottom of the index. The common thread across the lowest-scoring cities is the absence of compounding risk factors that define the top ten.
- Raleigh, NC (0.8) leads the index with the youngest housing profile in the study, soft water at 25 ppm, newer PVC pipe infrastructure, and the lowest service call rate of any city analyzed.
- Charlotte, NC (1.1) follows with over half of all homes built after 1990, soft water, and a regional pipe break rate among the lowest nationally.
- Austin, TX (1.8) rounds out the top three with a 35.8-year average home age, moderate water hardness at 84 ppm, and PVC-dominant underground infrastructure.
The caveat for movers: low overall scores can mask neighborhood-level risk. Older urban cores within otherwise low-risk cities can carry pre-1980 plumbing and harder local water that tells a different story than the citywide average. A pre-move inspection matters regardless of where a city lands on this index.
This data is courtesy of Roto-Rooter. The full rankings are available here.
Looking for a reprint of this article?
From high-res PDFs to custom plaques, order your copy today!


