
One of the biggest design compromises we make deals with the relationship between the heat output characteristics of a hydronic distribution system and the supply water temperature to that system.
In decades past, when fuel was cheap, the North American hydronics industry favored use of high water temperatures, which reduced the required surface area of heat emitters. The reasoning was simple: Why pay for 10 ft. of fin-tube baseboard in a room if 6 ft. could do the job using a higher water temperature? This is why you'll find thermal output ratings for fin-tube baseboard that go up to at least 220 degrees F. This made sense in a pre-OPEC, pre-AFUE, pre-EPA era.
Today, the picture is quite different and the trend is clear: the future of North American hydronics is reduced operating temperature. This is necessary to allow boilers to operate with sustained flue gas condensation, which in turn boosts thermal efficiency from the mid-80 percent to mid-90 percent range. The days of cheap fuel and scalded water design are over. My suggestion: don't design any system for supply water temperatures over 200 degrees F, and favor even lower temperatures whenever possible.
So what does this mean for heat emitters? Well, from the standpoint of improving thermal performance, it means that bigger is better. Longer baseboards, larger panel radiators, and perhaps tighter spacing on radiant panel circuits are all in order if the design goal is to reduce the operating temperature of the system to improve its thermal efficiency.
Putting Numbers In The Discussion: A fundamental principal in sizing any type of hydronic heat emitter is that heat output is approximately proportional to the difference between supply water temperature and room air temperature. This can be written mathematically as follows:

Formula 1
Where:Qoutput = heat output of heat emitter (Btu/hr.)
c = a number dependent on the type and size of heat emitter (Btu/hr./degrees F)
Ts = water temperature supplied to heat emitter (degrees F)
Tr = room air temperature (degrees F)
This relationship is true for a single heat emitter as well as a group of heat emitters operating as a distribution system.
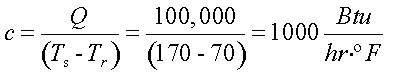
For example, suppose you have a building where all the heat emitters (as a group) release 100,000 Btus/hr. into a 70-degree F space when the distribution system is supplied with water at 170 degrees F. The value of the “c” in Formula 1 can be found as follows:

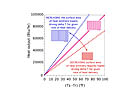
Formula 1 can also be represented by a graph. Figure 1 shows this for the same numbers used in the previous example.
All you need to construct this graph for a given distribution system is the heat output rate at one supply water temperature and the associated space temperature. Subtract the space temperature from the supply temperature to get the value of the driving delta T (Ts-Tr), then plot that point along with the associated heat output rate. This point must lie on the line, along with the point zero heat output at zero driving delta T. Just draw a straight line through these two points and extend it upward to higher values of (Ts-Tr) if you like.
The slope (steepness) of the line is determined by the number and size of the heat emitters that make up the distribution system. The larger the surface area of the heat emitters, the steeper the slope of the graph (see Figure 2).
Steeper lines indicate that a given rate of heat release occurs at lower values of the driving delta T. For a given room temperature, steeper lines favor lower supply water temperature. This, in turn, improves the efficiency of condensing boilers and other low-temperature hydronic heat sources.
In the case of spaces where the entire available floor area is heated, steeper lines are achieved by spacing tubing closer together. This lowers the supply temperature at which the floor will deliver a given rate of heat output. The radiant design software you use can probably give you numbers that relate tube spacing to heat output for a given type of installation and floor covering.
Adding the desired room temperature to the numbers along the bottom axis makes another useful variant of this graph. The graph now shows heat delivery vs. supply water temperature as shown in Figure 3. Note that each number on the bottom axis of Figure 3 is 70 degrees F (the desired space temperature) higher than the numbers along the bottom axis of Figure 2.
Seeking A Balance
Every hydronic system you'll ever design or install “wants” to operate at a condition called thermal equilibrium. This occurs when the rate of heat released from the circulating water exactly equals the rate at which heat is imparted to the water by the heat source. The water temperature in the system automatically adjusts itself as necessary to make this condition occur.If not for the intervention of temperature-limiting controls, every hydronic system would eventually stabilize at a supply water temperature where thermal equilibrium exists. This temperature may or may not provide the proper heat input to the building. Likewise, it may or may not be conducive to safe and efficient operation or long system life. Bluntly stated: The system “doesn't care” if it's delivering the proper amount of heat to the rooms or if it's operating safely. It only “cares” about achieving a balance between heat input and heat output.
You can use a heat output graph for a given distribution system to find the supply temperature at which that system will achieve thermal equilibrium with a heat source having a given heat output rate. First, locate the output rate of the heat source on the vertical axis. Now draw a horizontal line to the right until it intersects the sloping line. Finally, drop straight down to the horizontal axis to read the water supply temperature at which the system wants to operate.
For example: If a boiler having a fixed heat output rate of 60,000 Btus/hr. was coupled to the distribution system represented by Figure 3, that system would seek to operate at a supply water temperature of 130 degrees F.
This graph can also be used to predict the supply temperatures that occur as a modulating/condensing boiler reduces it firing rate. Here's another example: At a peak 80,000 Btus/hr. heat input rate, the distribution system represented by Figure 3 would settle to a steady supply temperature of 150 degrees F. If the boiler firing rate in the same system was reduced to 25 percent of this peak rate (20,000 Btus/hr.), the distribution system would settle to a supply temperature of 90 degrees F. It's easy to see that the water temperature a system operates at is based on the rate at which heat is “injected” into it, rather than the setting on the boiler limit control.

Running Interference
Earlier I mentioned that temperature-limiting controls sometimes interfere with a system as it attempts to naturally find thermal equilibrium. Here's how that works.If the temperature-limiting control of the heat source is set below the thermal equilibrium temperature, the heat emitters in the distribution system will not get hot enough to dissipate the full (steady state) output of the heat source. The temperature of the water leaving the heat source will climb as the system operates, eventually reaching the temperature setting of the limit control. At that point, the heat source (burner, compressor, etc.) is turned off.
The water temperature leaving the heat source begins to decrease as heat continues to be dissipated by the distribution system. Eventually, the temperature drops to the point where the heat source is turned back on, and the cycle repeats. This is a very common operating mode in many systems during partial load conditions. It can even occur under design load conditions in systems having an oversized heat source.
If the temperature-limiting control on the heat source is set above the temperature at which thermal equilibrium occurs, the water leaving the heat source will not be able to achieve that temperature setting unless the load is reduced or turned off. This explains why some systems never reach the set-point of the boiler limit control, even after hours of operation.
In simple terms, the distribution system doesn't need to climb to the boiler limit control setting to dissipate all the heat the boiler can throw at it. It only climbs as high as necessary so that all boiler heat input can be released. This is generally OK, provided that the boiler is not a “conventional” boiler operating with sustained flue gas condensation. Be wary of this when converting older cast-iron radiator systems with lots of radiator surface area to a water-based system, especially when the building envelope has been significantly improved to lower heat losses.
Downhill Trends: It's absolutely certain that hydronic heating systems in North America will be designed with increasingly lower supply water temperatures. This makes sense from the standpoint of efficiency and environment. It also makes sense from the standpoint of comfort. Large surface-area heat emitters improve comfort by increasing the mean radiant temperature of the room.
Get your head around the idea that the higher installation cost associated with lower system-operating temperatures is only part of the picture. Reduced operating costs, lower emissions and enhanced comfort are the other part. As crude oil prices close in on $75 per barrel with little hope of significant future price reductions, that other part is looking pretty good.
